
As teachers, we are creating things all the time. Everything from course materials, PowerPoints, newsletters, websites, bulletin boards, even t-shirts. I’m not a graphic artist and don’t consider myself overly artsy in the traditional sense, but I love designing things like this. Finding the perfect graphic, arranging items on the screen, choosing just the right font…The whole process is appealing to me. Allow me to share my method for finding an appropriate graphic, recoloring it, and turning it into something that makes me smile – all for free.
Copyright Issues
If you are like me, you are constantly talking about plagiarism and integrity with your students. In an effort to practice what I preach, I try to either cite the graphics I use, or find graphics that are free to use.
I do not recommend simply doing an image search and swiping your favorite images. Unless specifically stated, content on the internet belongs to the person who created it. A creator does not have to register an image or include a copyright symbol for the material to be protected. You can find more information about the copyright laws protecting images here.
Most of the images on my site have come from free sources that do not require attribution. The major exception is my chemistry girl. I found her on Etsy and paid for extra licensing so that I do not have to provide attribution. Personally, I think she is adorable and totally worth it.
Sources of Free Graphics
There are tons of free sources of images out there. My favorite is Pixabay. You’ll find that Pixabay is totally free and the licensing for the images specifically states that “No attribution is required.” These images are free to use, modify, and post to your heart’s delight.
I like to use graphics rather than pictures and change the colors to match my themes. Pixabay makes this easy. The search bar in Pixabay has a dropdown menu where you can select “illustrations.” This will narrow your search to only include graphics.
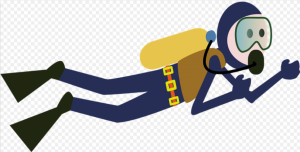
Here is an example of a fun picture that I found on Pixabay. You can see the original on the left plus the updated version after I’ve played with the colors on the right. (The section on Paint 3D below details how I changed the colors).


Several sections of my website are attempting to use graphics to teach scientific concepts, meaning I sometimes need more specialized graphics then the ones on Pixabay. This is when I turn to a Google Image search, but I specify that I want images that are free to use.
When searching Google Images, select the “Tools” feature just under the search bar. Then select “Usage Rights” to choose images that are free for whatever purpose you desire. If you do not see the “Usage Rights” option, make sure you have selected “Images.” The normal Google search does not have this option.
Many of the free to use images I find in a Google image search come from WikiMedia Commons. These images often indicate that the author should be given attribution for the image. Here is an example where I found an image that I loved and gave the author the appropriate attribution:

Choosing a Color Scheme
You may decide that you want to stick to a color scheme as you design images for your classroom or class webpage. This was one of the first decisions I made when I started designing my website and it has saved me a ton of time. I do not agonize over colors because I have already chosen a color scheme.
This is the website I used to choose a color scheme: Website Color Schemes by Canva. There are 50 different options of color schemes with examples of how the colors work together. Just scroll through and pick the one that makes you smile. The website provides the color codes that show up in the scheme. I have mine written down beside my workspace. Anytime I’m playing with an image, I start with my colors. Whether you find me on YouTube, Facebook, Pinterest, or Instagram I want my images to be recognizable.
Transparent Backgrounds
I always change the colors of the images I find, so I choose images that I know will work well with that process. When I search for an image, I’m looking for a limited number of colors in the image and clearly defined lines between the colors. The process I’m about to show you will not work as well if there is a lot of shading or gobbledygook in the image. (Side note: I’m totally baffled that gobbledygook showed up in spell check! Who knew?)
I also really love to start with images that have a transparent background. This typically means that the file format will be “.png.” You’ll recognize these in Pixabay because when you click on them to download you will see the checkered background. The checkered background does not show up in Pixabay’s search, but only once you have selected an image.
The checkered background will not show up when you place the image. The color of whatever document you import the image into will show through.
The program that I use to edit colors is one that came pre-installed on my computer. It is called Paint 3D. (The regular Paint program will color fill, but it is a little more complicated to keep the transparent background. There is a workaround for that posted here that you may find helpful if you choose to use Paint.
Using Paint 3D to Change Image Colors
Steps for changing image colors:
- Open the image in Paint 3D.
- Click the “Canvas” tab at the top of the screen. Ensure that the “Transparent Canvas” button is toggled to On.
- Click the “Brushes” tab at the top of the screen.
- The brush options appear on the right side of the screen. You want the one that looks like a paint bucket. Hovering over it shows the word “fill.” Select this brush.
- Select the color that you would like to fill. The large rectangle shows your current color. Click this color to get more color options and to type in specific color codes.
- Select the area of the graphic you would like to fill.
- Repeat this process until you have changed all the colors in the graphic.
- For changing intricate colors it is helpful to zoom in. The undo button at the top of the screen is your friend!
- Once your image is perfect, select “Menu” and then “Save As.” Then click “Image.” This allows you to choose your file format. For transparent backgrounds, keep this as a .png file.
I think you will find Paint 3D fairly simple to use once you play with it some. The key is to choose images that have distinct boundaries between their colors. I like the look of these anyway because they are clean and simple.
Importing Into PowerPoint
My last tip here is to learn to love PowerPoint. I import the graphics that I recolor into PowerPoint. Then I can add text, rearrange, add borders, add shadows, etc. PowerPoint allows you to change the slide size. You can make an entire worksheet or newsletter in PowerPoint with really great editing features, then save it as a PDF (just set the size of the slide to 8.5″ by 11″). Trust me on this one. If you are using a lot of graphics on the things you are creating, PowerPoint is incredibly powerful. I highly recommend adding it to your tool box.
What Do You Do Differently?
I’d love to hear from you. Was this helpful? Do you have a program that simplifies this process? Please let me know in the comments.

Leave a Reply